Table of contents
Adventures on vue.js and data visualization - episode 1
The content here is under the Attribution 4.0 International (CC BY 4.0) license
Join Our Community
Connect with developers, architects, and tech leads who share your passion for quality software development. Discuss TDD, architecture, software engineering, and more.
→ Join SlackI have been using reactjs for most of my projects and it was my go to in new projects, therefore, as my landscape changes I try to adapt as much as possible and I enjoy learning new things. I have touched a couple of years ago vue.js that is a mix of vue.js and d3. There, I try to depict different charts (bar, bubble and word cloud) to visualize a high level information about a given github repository.
Currently, I am working on a project that uses vue.js + nuxt.js. This project itself triggered me back to this data-viz (data visualization) project of mine that could help me get familiar with vue.js ecosystem again and bring me back the joy of using it daily. In a nutshell, I am writing this post to expose my intentions and what I will do along the way, in this episode 1, we are going to dive into the adventure.
The project
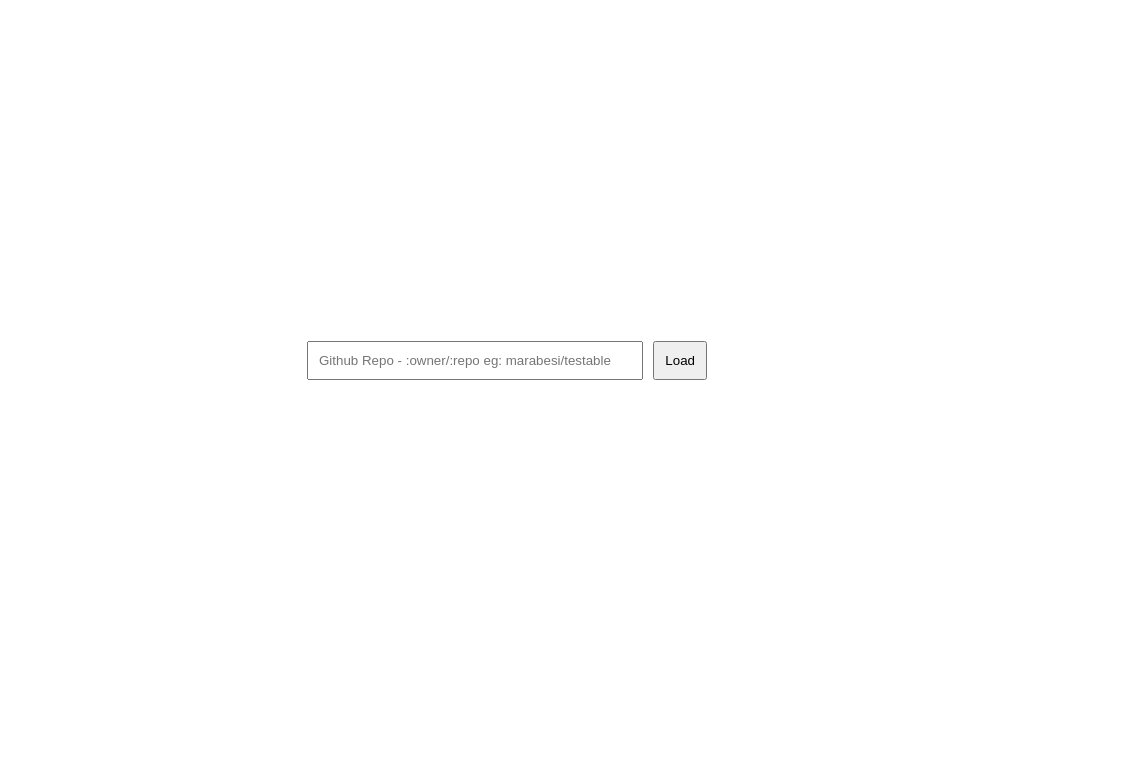
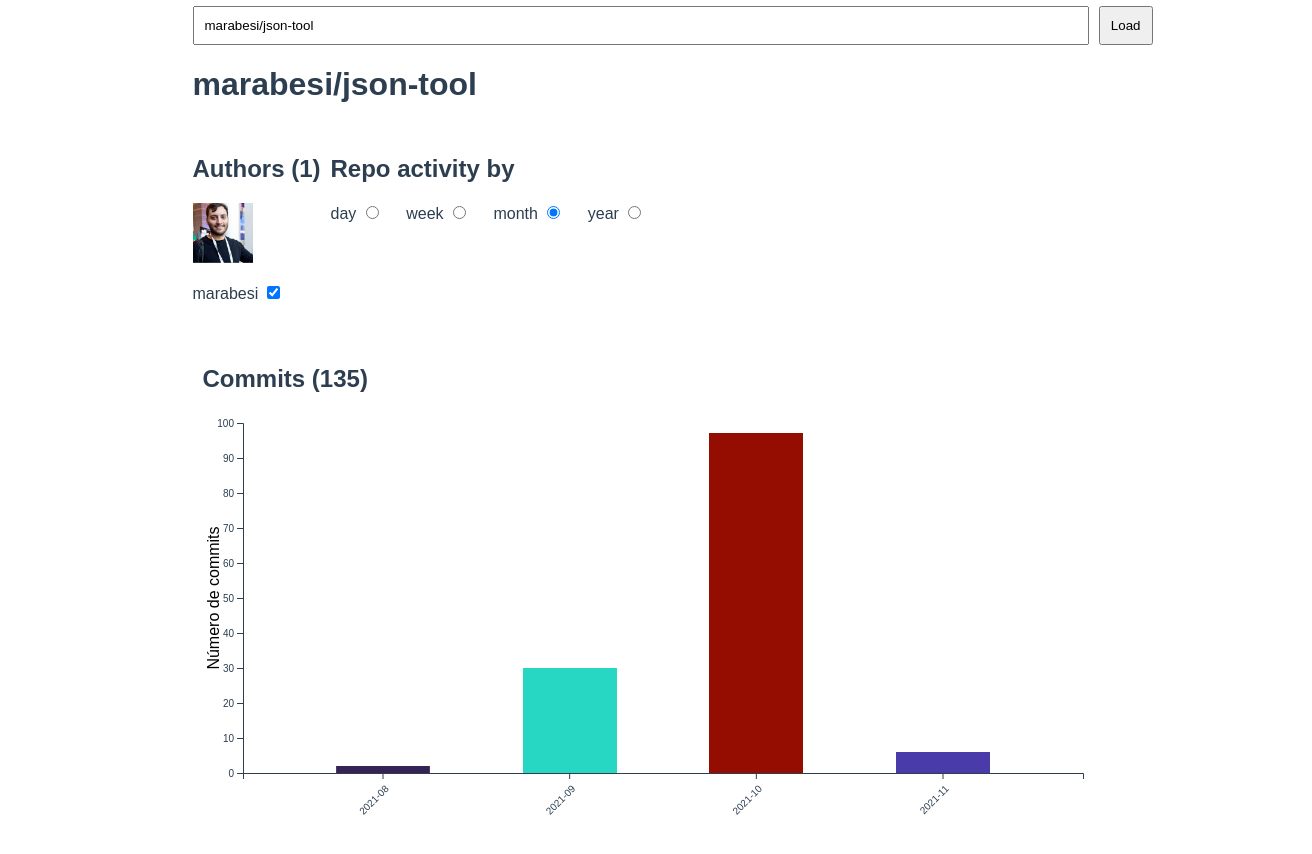
Before that, let’s warm up with the gist of the project, here goes three different images. The first is the home screen which the user provides which github repo she wants to see, the second is the barchart that is loaded once the data has been received from github, and the third is the bubble chart and the word cloud that is created based on the github data as well.
Barchart rendered by month:
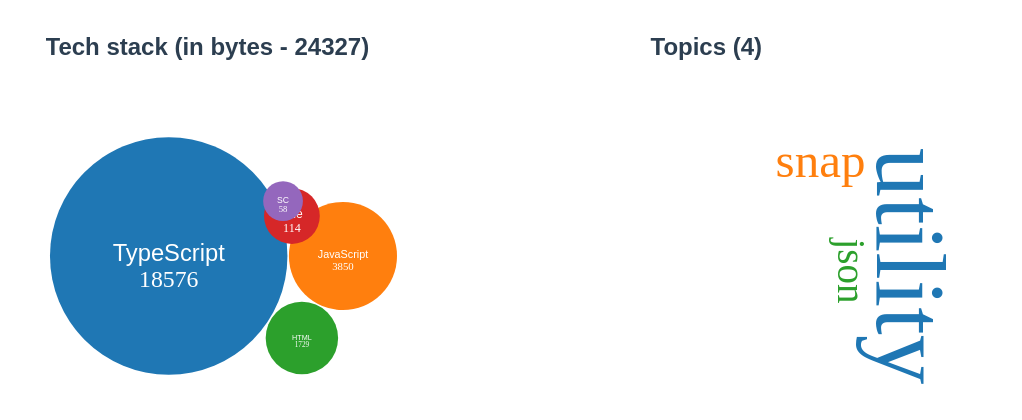
Bubble chart and word cloud, word cloud is based on the topics and the bubble chart in the tech stack of the repository.
This project was built to fetch some information and share it in the dissertation I wrote for my MsC, it gives basics information but it did the trick.
As a side project, it was built in a “hurry” and just for my personal usage, but it ended up open in github and I use it still today. The problem with that is, along the hurry, a lot of technical debt was left behind - the project it self works, but was developed using PDD (Pray Driven Development) and also it is easy to spot some code smells.
Future work
Given the situation, I thought with myself: wouldn’t it be a good idea to give some love to that data-viz project and do some clean up?
In the hope that this series will live for a while, I am writing this report. The idea is to list what I am planning to work on along the way and update it as it evolves. To get start with I have the following list to work on:
- Replace vue testing utils by testing library.
- Build some tests to enable refactoring and code improvements.
- Enable a way to input the client secret and client id.
- Upgrade vue.js version to the latest (latest = the one that is available at the time of the update).
- Improve the file structure - the code itself has some mixed responsibilities and would be good to keep it in a SOLID way.
- Upgrade d3 version, currently the one used is 5.
I am not planning to keep any hard deadline for keeping this series going on but I am willing to push this one at least one a week. Stay tunned for the next episodes on this project!