Driving Organizational Excellence: A Comprehensive Book Review and Personal Insights on 'Accelerate - Building and Scaling High-Performing Technology Organizations'
The content here is under the Attribution 4.0 International (CC BY 4.0) license
Join Our Community
Connect with developers, architects, and tech leads who share your passion for quality software development. Discuss TDD, architecture, software engineering, and more.
→ Join SlackDelivering software fast and keeping quality is challenging (Dave Farley challenges the potential trade-off between speed and quality, elaborating on the argument that the one depends on the other, instead of the one blocking the other). Accelerate brings the light through data on the DevOps culture and practices. DevOps (even though the term wasn’t there?) has been adopted by the industry for a while and Accelerate dives into the practices of what makes successful teams deliver software fast and also what holds them back from improving the delivery process. Besides that, the book is accessible for different profiles within the technology world (software engineer, cyber security, quality engineer, etc) (Radziwill, 2020).
Should you read it?
The book stands out because it is grounded in rigorous research and data, not just opinions or anecdotes. It explains the four key metrics that matter for high-performing organizations and connects them to 24 actionable capabilities across technical, process, and cultural domains. The insights are practical, evidence-based, and applicable to teams of any size.
If you want to understand what truly drives software delivery performance, how to measure it, and how to improve it systematically, Accelerate provides both the “why” and the “how.” It’s accessible, well-structured, and referenced by many leaders in the industry.
Before starting
This post follows the same structure as the book, but instead of three (as the third one is related to a study case and challenges faced) it will be split into two parts. The first will go through the results found and the second, will dive into the research process.
There was a 'Moved Permanently' error fetching URL: 'https://twitter.com/MatheusMarabesi/status/1450217625087315968'
The companion for this content is the mind map that was built after the reading process and along the reading process, the sections that follow have the mind map bit, which corresponds to the subject being discussed.
Part 1
The first part of the book focuses on the insights that the data showed to researchers, pointing to which capabilities lead to improvement in software delivery. The premise used is that business as usual is not enough to innovate and strive to succeed in business, according to the authors, a Gartner survey showed that 47% of CEOs face pressure to deliver digital transformation. On the other hand, if the CEOs face that pressure, part of it might impact how companies deliver software. Note that the delivery of software is not something new that was introduced by Accelerate, Alistair in 2004 was pointing towards a Crystal Clear that has as its first property frequent delivery. (Becker & Cockburn, 2004).
The following list depicts the four metrics used to build a guideline of what to measure. Early in the process, the authors described that measuring velocity has several flaws, as it focuses on how fast something was delivered, it is context-dependent and teams usually game their velocity. In other words, teams once perceive that they are being measured for how fast they deliver they will start to overcome pre-defined rules to improve that, which in this case, for the results presented makes not much sense.
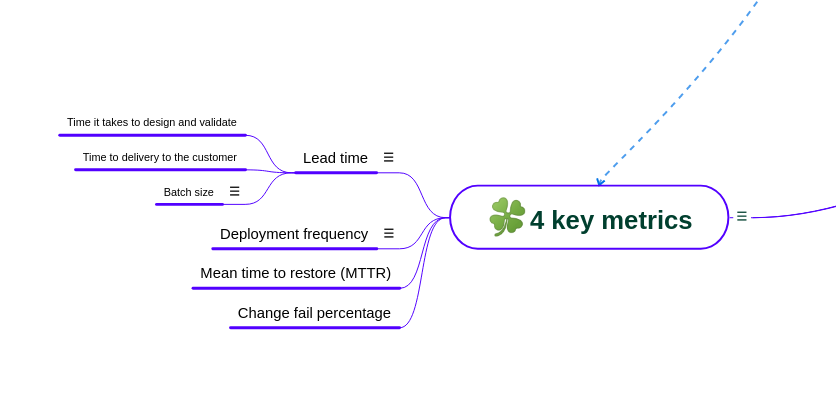
The four metrics as described by the authors focus on the global outcome, rather than the velocity itself. Global outcome is an approach that is harder to game in terms of velocity. It even makes it easier to see the effect on the deliverables.
- Lead time (LT): Measures how long it takes from a request until it is available for the customer to use (often related to deployment to production).
- Deployment frequency (DF): This metric is associated with the pain that engineers have to deploy changes for customers.
- Mean time to restore (MTTR): Restore is measured by how long it takes for something to get fixed if it is broken, it is related to the next metric.
- Change fail percentage (CFP): How often you fail, if anything gets into production that fails.
I liked the image that IT Revolution made with the metrics, it makes it easier to remember and the adaptation that was made in the post is welcome for people who want to have a taste of what the book looks like.
The metrics are connected to the capabilities found by the authors, in a sense that, each capability listed, may impact the metric score, positively or negatively. (Sallin et al., 2021) Published a prototype to automatically measure those metrics.
Capabilities
The key for metrics is connected to 24 capabilities that impact the global outcome, depending on which capability is being inspected, it might interfere with one or more metrics used.
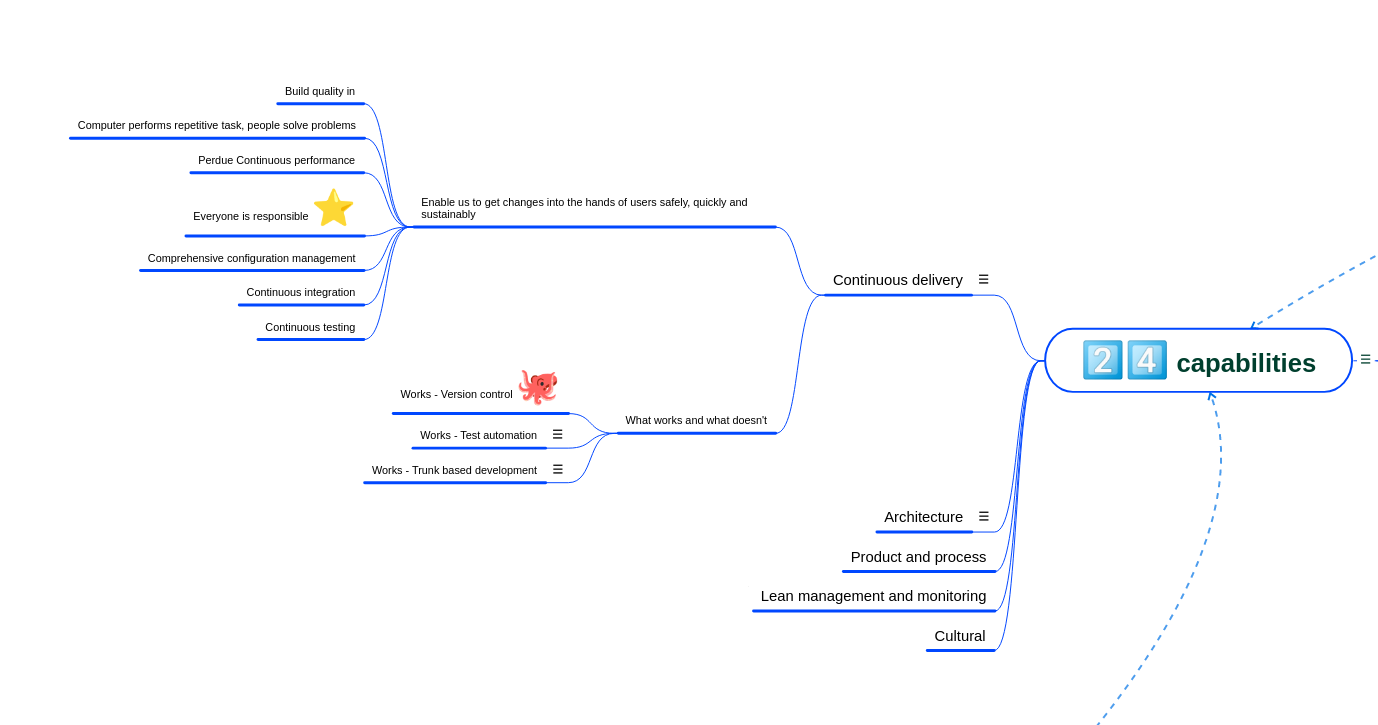
In total, the authors of Accelerate identified 24 capabilities that are essential for driving improvements in software delivery performance (Nicole Forsgren, 2018). These capabilities are not isolated practices, but rather are grouped into five overarching categories, each representing a critical dimension of high-performing technology organizations.
1. Continuous delivery
- Version control for all production artifacts - Git has become the standard for version control.
- Deployment automation
- Continuous integration
- Trunk-based development
- Test automation
- Test data management
- Shift left on security
- Monitoring and observability
I shared my review about Continuous delivery, the content goes over the famous book about continuous delivery by Jez Humble and David Farley, which is a must-read for anyone interested in software delivery. The book is a great companion to Accelerate, as it goes deeper into the practices. The coursera course that I refer also use it as a reference.
2. Architecture
- Loosely coupled architecture
- Empowering teams to choose tools
- Ability to make changes independently
- Architect for empowered teams
I have dedicated a space just for Architecture in this blog.
3. Product and processes
- Working in small batches
- Limiting work in progress (WIP)
- Visual management of work
- Customer feedback loops
- Lightweight change approval processes
4. Lean management and monitoring
- Proactive monitoring
- Use of WIP limits
- Visual displays of key metrics
- Regular retrospectives
- Experimentation and learning culture
5. Cultural
- Psychological safety
- Blameless postmortems
On 2, I can refer to episode 53 of the tech lead journal (Suryawirawan & Richardson, 2021) that talks about using microservices as a way to enable the four key metrics measurement and improvement. Despite the metrics not referencing directly velocity, more recently, in (Saarimäki et al., 2023) the authors empirically investigated the relationship between velocity betweent monotlih architecture and microservices architecture, concluding that there were no significant differences between the two architectures in terms of velocity.
The first part of Accelerate lays a strong foundation by connecting measurable outcomes to actionable capabilities, offering a clear roadmap for organizations aiming to improve their software delivery performance. By understanding how these 24 capabilities influence the four key metrics, teams and leaders can prioritize their efforts and investments. With this practical framework in place, the book then transitions to explore the scientific rigor and research methods that underpin these findings.
Part 2
Accelerate introduces the results that came from the research in part 1, and in part 2, it goes deeper into the science behind that. The interesting part is how it was decided to follow up with a survey instead of any other method.
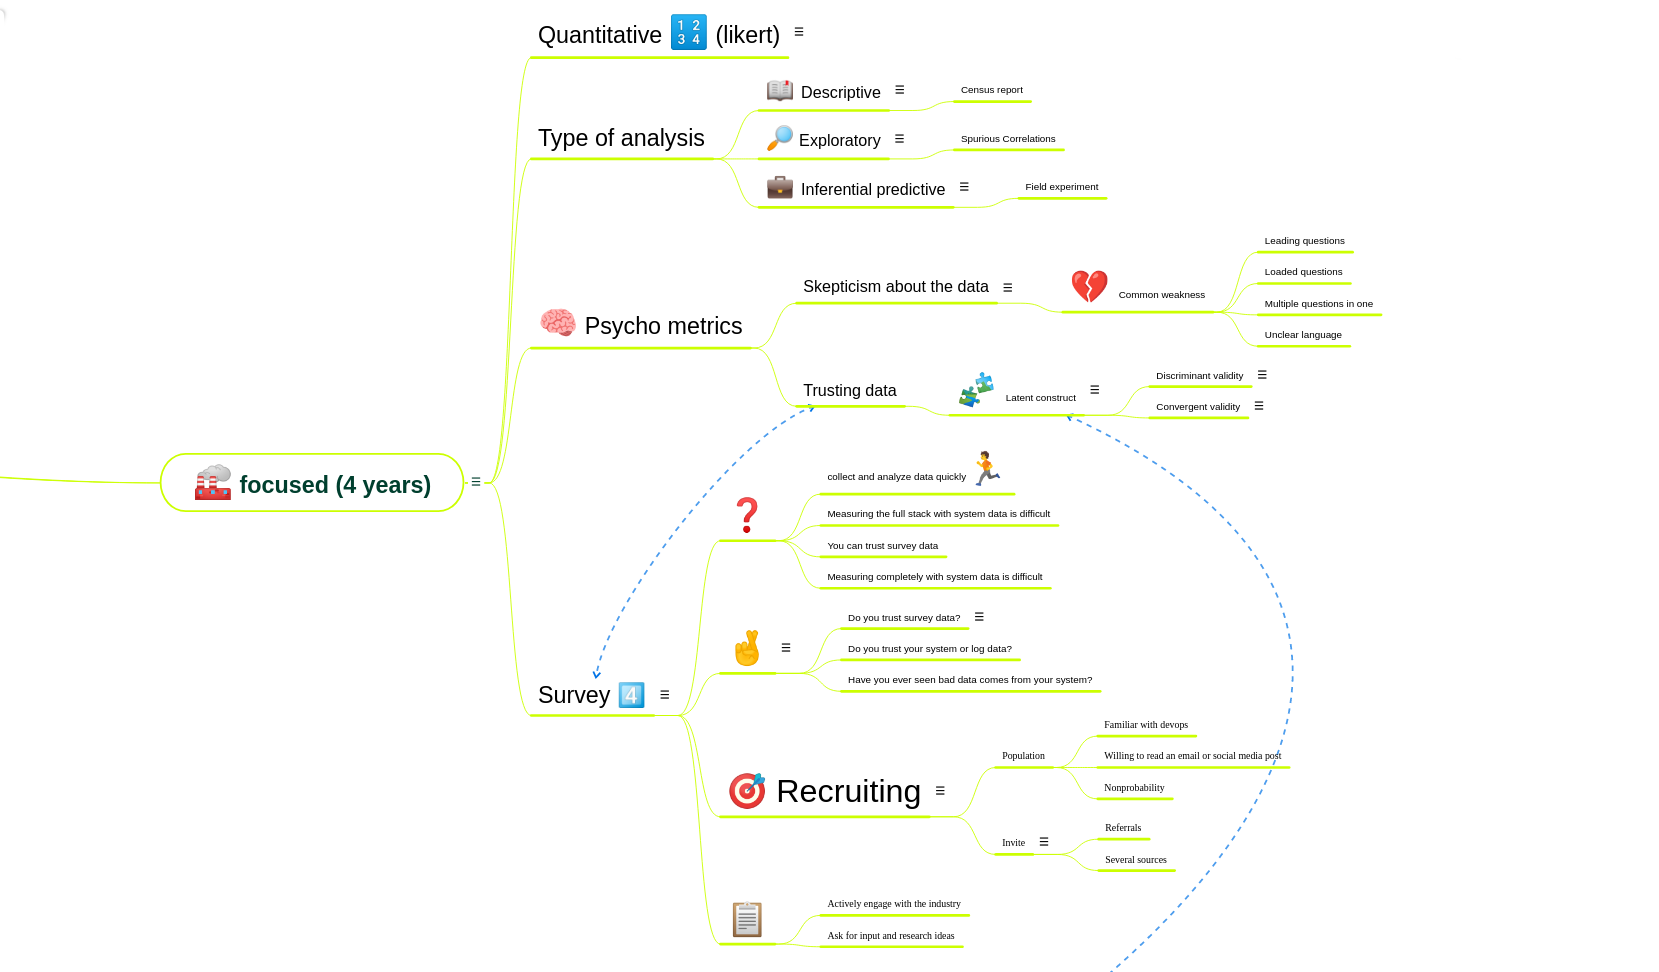
The authors argue that a survey usually is not a trusted source. Survey takers can lie leading to “invalid” data, which would be “easier” to avoid using logs for example. If that is the case, the authors also argue that trust in the system is needed as well. In that sense, there is no 100% guarantee that all the collected data, be it from surveys or logs will be correct.
Therefore, there are ways to mitigate this issue, and for that, the authors used a statistical analysis. Another way to frame it was the size of the survey. In total, there were around 23.000 answers, and to impact that, a lot of people would have had to lie in an orchestrated way. (Which is not impossible but very unlikely that happened).
Final considerations
Accelerate for me gives me a perspective on how to approach software delivery in both ways: in theory and practice. The collected data points aim to show how effectively delivery software is in a digital era, in which each day developers are on the front line, trying to deliver as much value as possible.
The metrics, used to measure global outcome (delivered value) rather than individual contributions are connected to how it is important to work as a group, the team interests have priority on individual goals. This is the present and the future. Even though, I would bet that most big organizations that are struggling to innovate are penalized for not having this mindset in place.
All in all, for me, the argument used to depict the context of why to use a survey and how to approach the analysis statically gives the perspective on how the work was conducted, focused on the data, instead of biased opinions or “feelings”. Some might argue that still there will be bias, and that’s for sure, but exposing the methodology as it was done is a way to make it explicit to the reader.
I have shared challenges that I have faced in the past with the DORA metrics, and how they can be difficult to track. Practitioners should be aware of that while implementing those metrics.
Accelerate Book Insights Quiz
Follow up
- DevOps Culture and Mindset - Coursera - In this course, accelerate is referenced as the DevOps book that is used to understand the DevOps culture and mindset. For example, working with small batches, reduced risks, accelerate feedback and reduces cycle time.
- SPACE - The SPACE of Developer Productivity
Related subjects
- Software Development with Feature Toggles: Practices Used by Practitioners
- The Links Between Agile Practices, Interpersonal Conflict, and Perceived Productivity
- Measuring productivity in agile software development process: a scoping study
- What Makes Effective Leadership in Agile Software Development Teams?
- It’s Like Coding in the Dark
- Keynote - Chris Richardson - Microservices Patterns
- Metrik - An easy-to-use, cross-platform measurement tool that pulls data out of CD pipelines and analyzes the four key metrics for you
- The 2019 Accelerate State of DevOps: Elite performance, productivity, and scaling
References
- Radziwill, N. (2020). Accelerate: Building and Scaling High Performance Technology Organizations.(Book Review) 2018 Forsgren, N., J. Humble and G. Kim. Portland OR: IT Revolution Publishing. 257 pages. Taylor & Francis.
- Becker, A. P., & Cockburn, A. (2004). Crystal clear: a human-powered methodology for small teams. Pearson Education.
- Sallin, M., Kropp, M., Anslow, C., Quilty, J. W., & Meier, A. (2021). Measuring Software Delivery Performance Using the Four Key Metrics of DevOps. In P. Gregory, C. Lassenius, X. Wang, & P. Kruchten (Eds.), Agile Processes in Software Engineering and Extreme Programming (pp. 103–119). Springer International Publishing.
- Nicole Forsgren, G. K., Jez Humble. (2018). Accelerate: Building and Scaling High-Performing Technology Organizations. https://www.goodreads.com/en/book/show/35747076-accelerate
- Suryawirawan, H., & Richardson, C. (2021). #53 - Principles for Adopting Microservices Successfully - Chris Richardson. https://techleadjournal.dev/episodes/53
- Saarimäki, N., Robredo, M., Vegas, S., Juristo, N., Taibi, D., & Lenarduzzi, V. (2023). Does Microservice Adoption Impact the Velocity? A Cohort Study.
Changelog
Edit May 24, 2024
- Added follow up for the book section
Edit Apr 14, 2024
- Included reference to Crystal Clear in the text
- Updated grammar errors
Edit Jul 08, 2022
Response from Jez Humble to a tweet that criticized the Accelerate book content:
There was a 'Moved Permanently' error fetching URL: 'https://twitter.com/jezhumble/status/1545242415912497154'
- A review of Accelerate: The Science of Lean Software and DevOps
- Response to Keunwoo Lee’s review of Accelerate
Edit Oct 20, 2021
Adds (Sallin et al., 2021) in the section Part I.